Create and View Reports and Charts from Your Existing Dataset in Batoi CloudSpace
Add Report
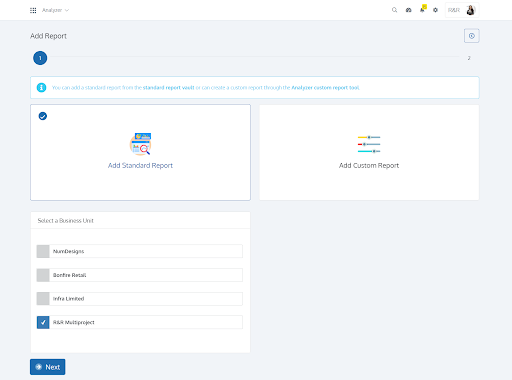
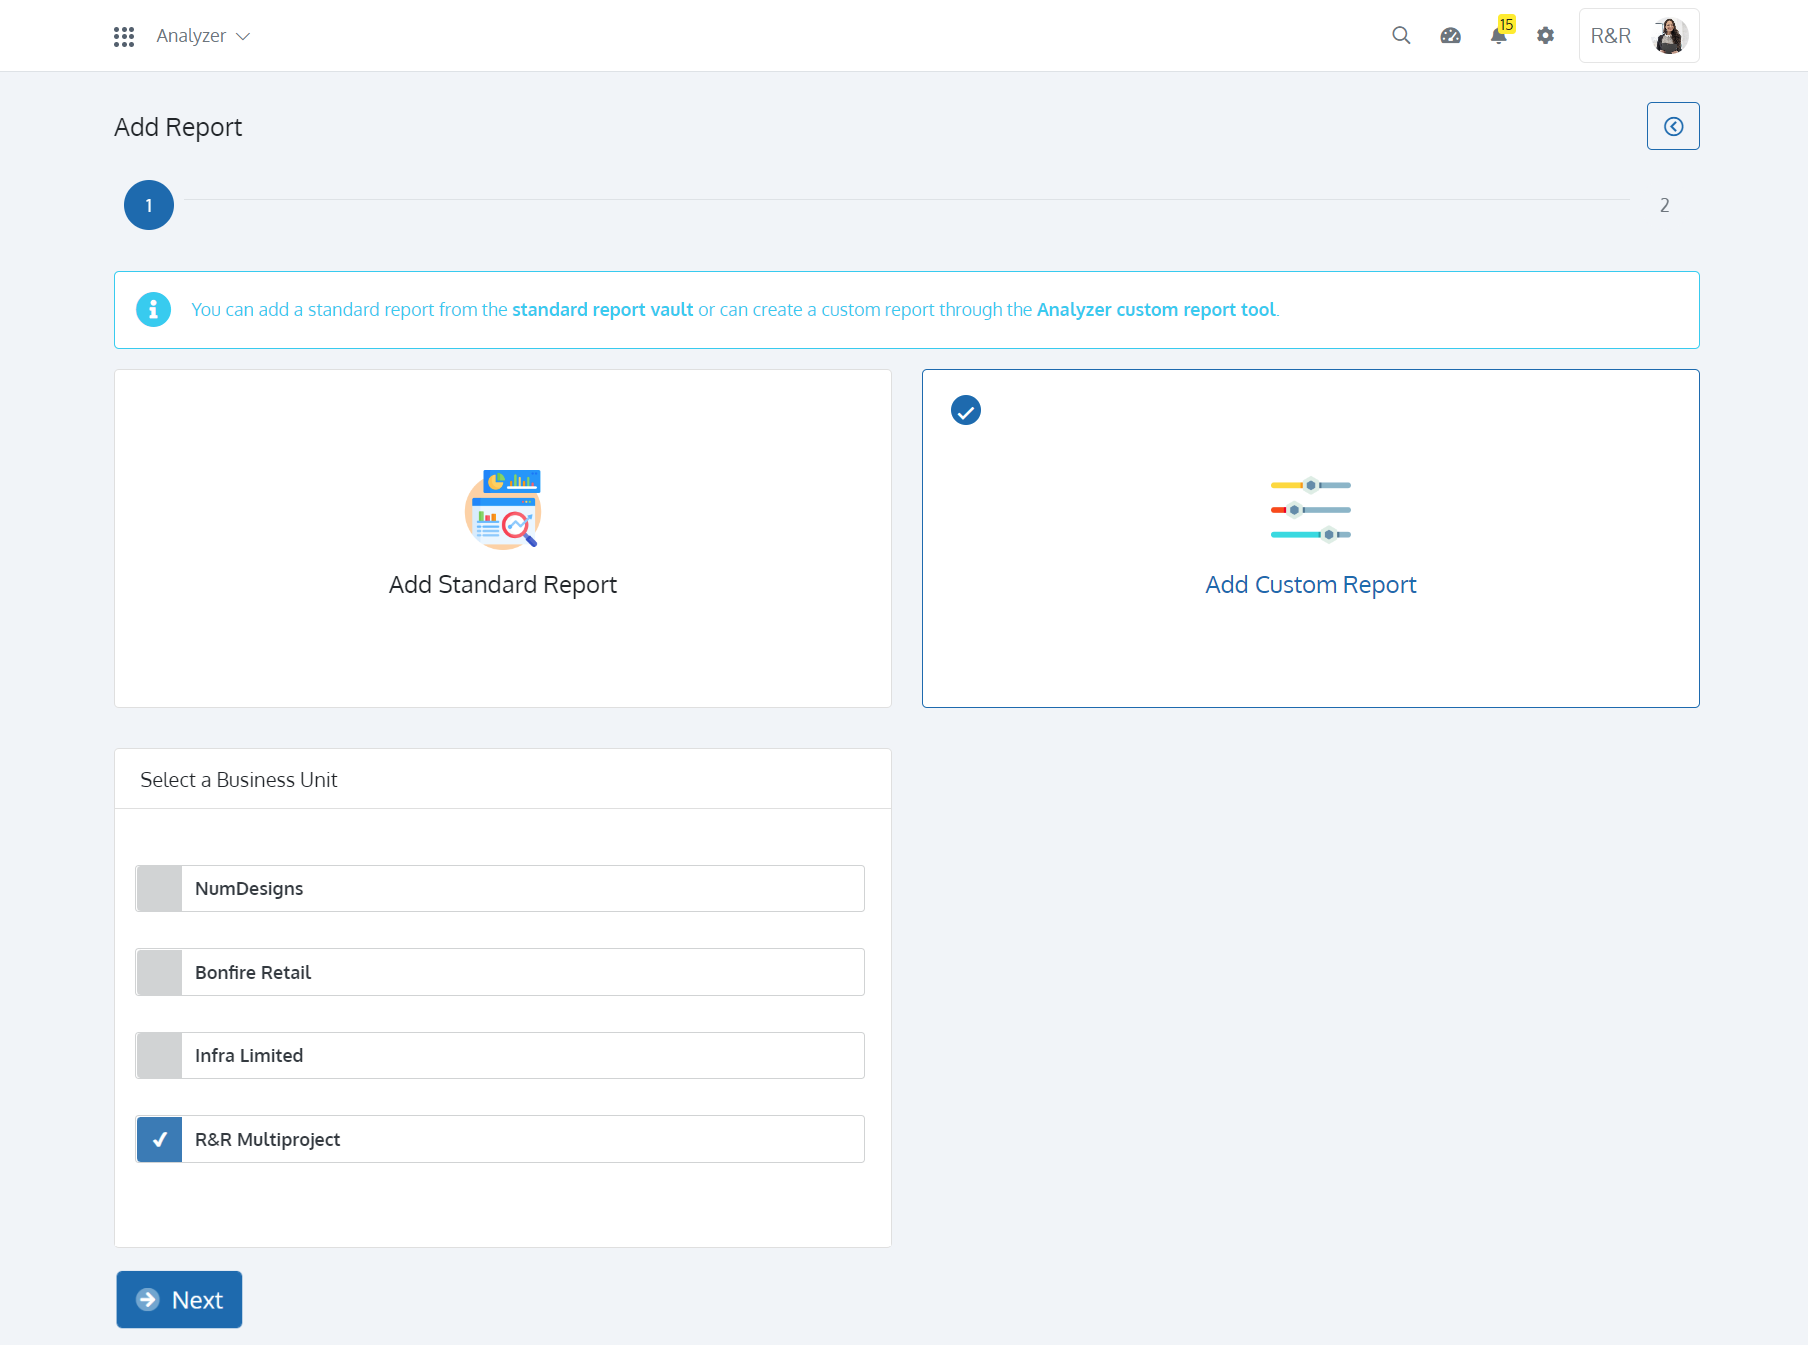
With the Analyzer app on Batoi CloudSpace, you can add a standard report from the standard report vault or create a custom report through the Analyzer custom report tool. The Analyzer app lets you add standard reports of two types: Task Report and Project Report. Add a Standard Report by selecting ‘Add Standard Report’ and ‘Business Unit’.
Task Report
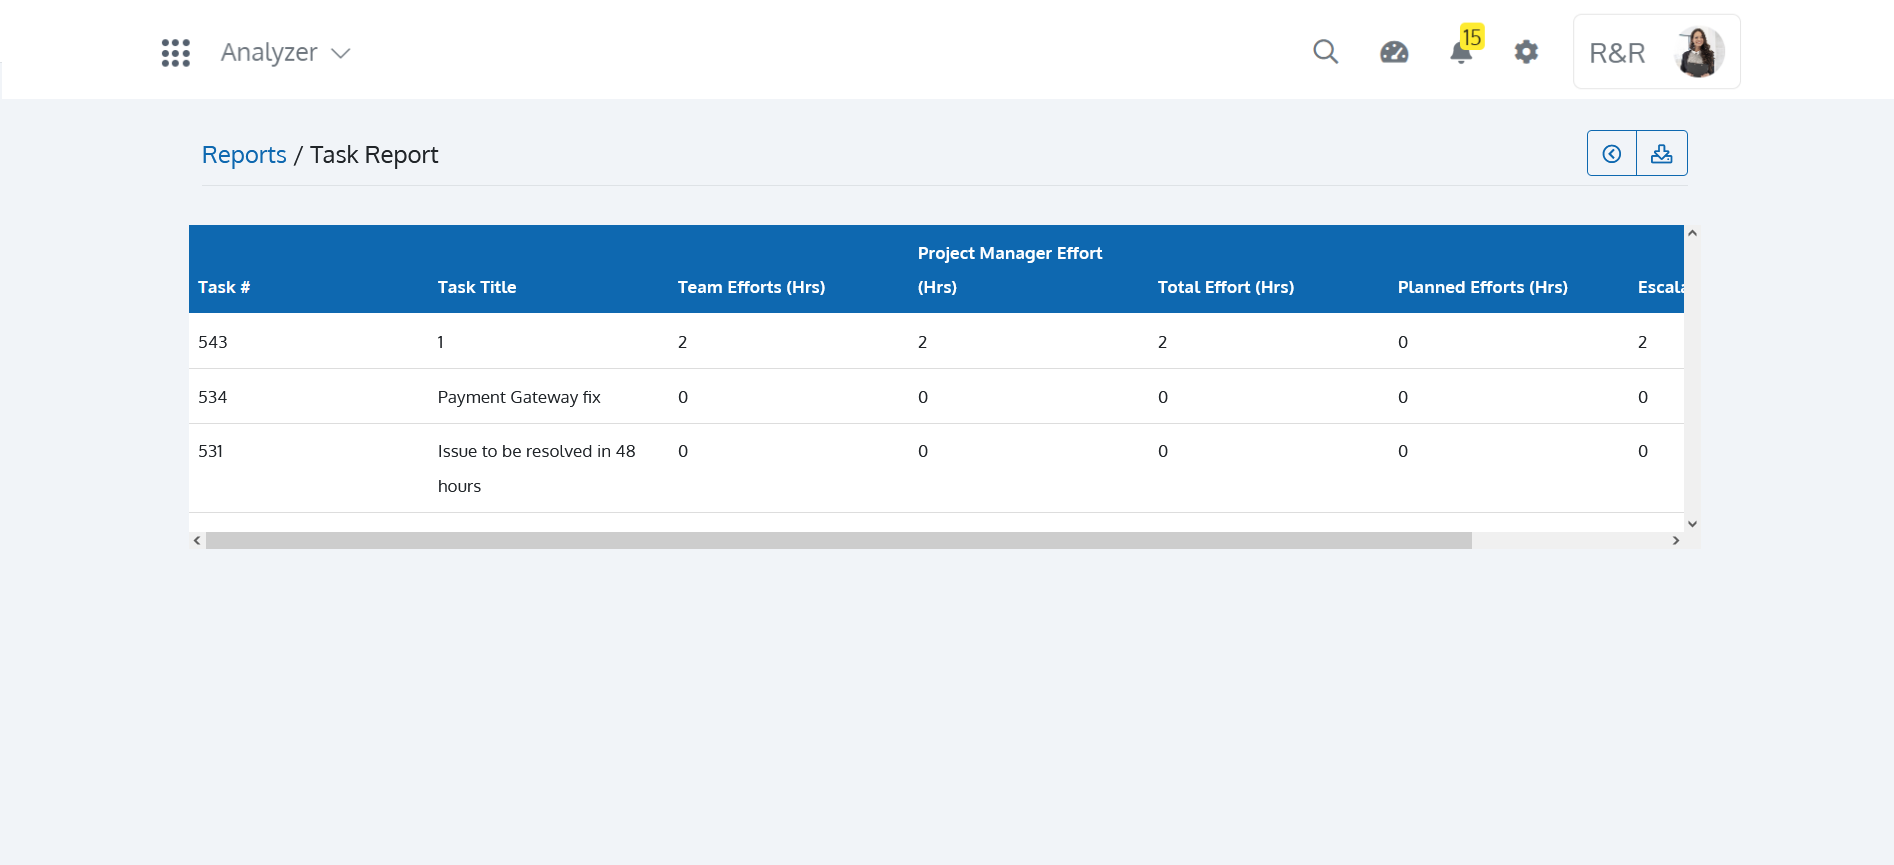
The Task Report summarizes performance indicators pertinent to each team member's task. The Task Report contains basic details of Tasks like ‘Task Title’, ‘Team Efforts (Hrs)’, ‘Project Manager Effort (Hrs)’, ‘Total Effort (Hrs)’, ‘Planned Efforts (Hrs)’ and ‘Escalation (Hrs)’. Your sales and marketing initiatives may be improved, and you can make more informed business decisions by utilizing the information you get from these reports.
Project Report
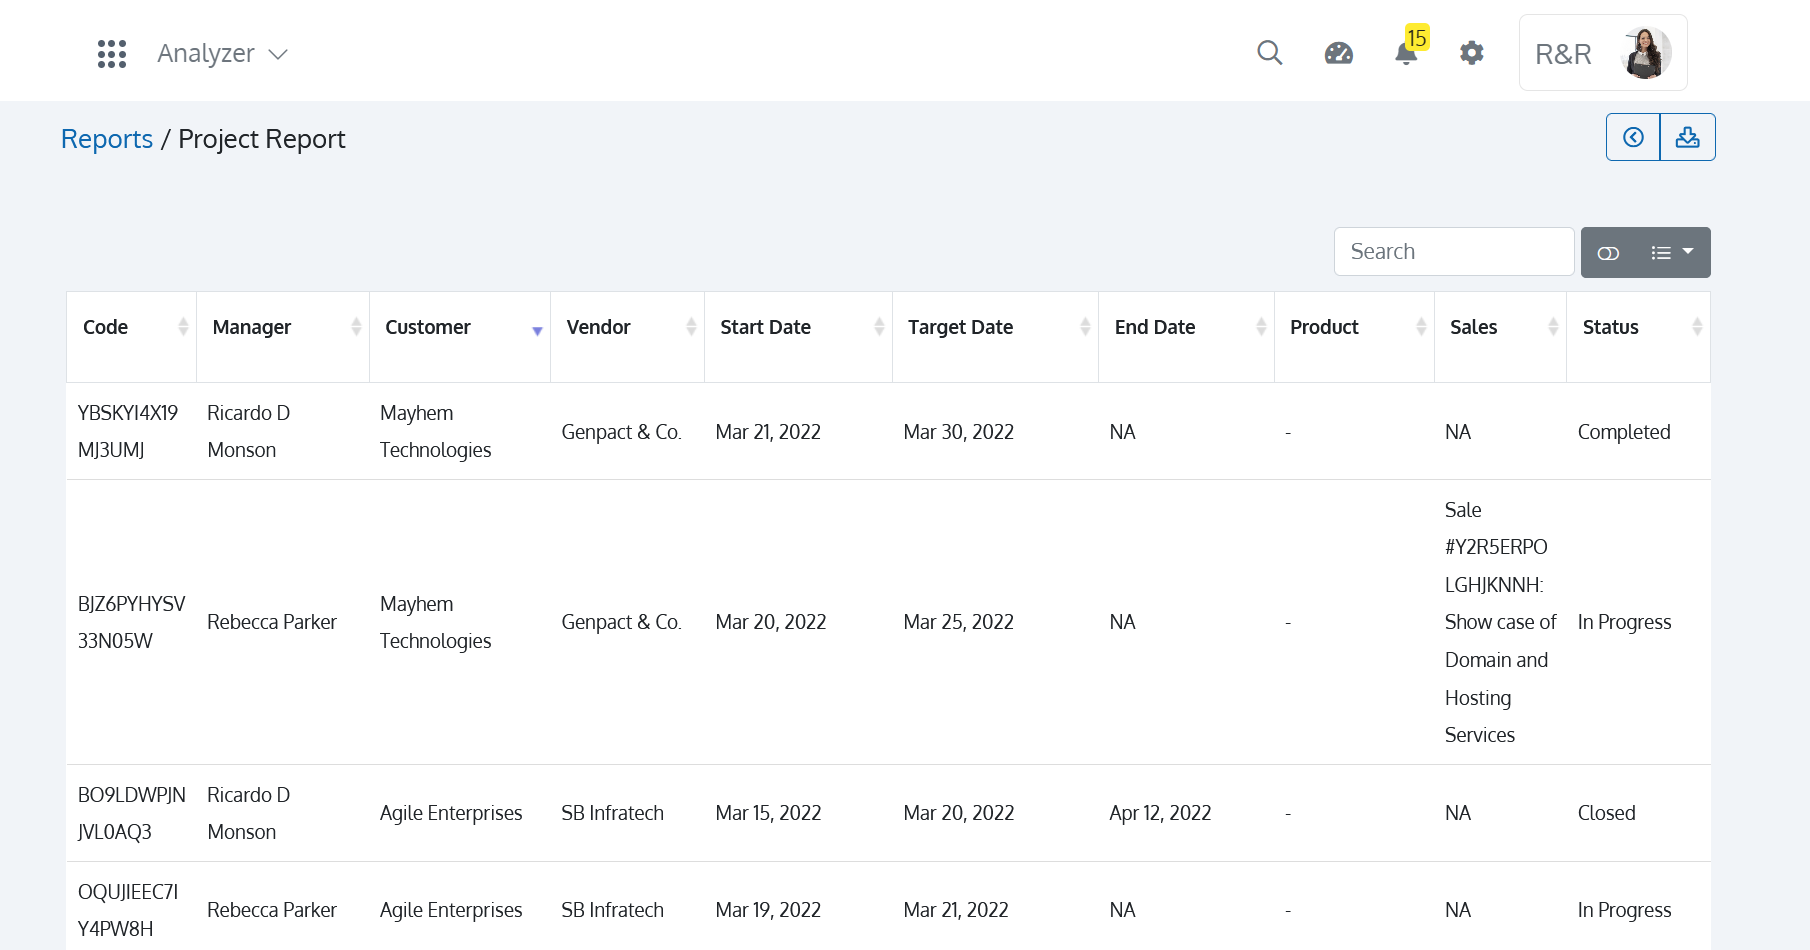
The project report is a factual record of the progress or results of a project, either generally or concerning particular parts of the project's status. It comprises project data based on economic, technical, financial, managerial, or production elements. The Project Report contains basic details of Projects like the Project ‘Code’, ‘Manager’ responsible for the Project, ‘Customer’ name, ‘Start Date’, ‘Target Date’, ‘End Date’, ‘Product’, ‘Sales’ and ‘Status’. You can also toggle between List View and Card View. You can also decide on the ‘Columns’ you want to appear in the Project Report. You can also download the Reports in CSV format for future reference.
Custom Report
Custom Report helps you create your report with your datasets. Add a Custom Report by selecting ‘Add Custom Report’ followed by choosing a ‘Business Unit’.
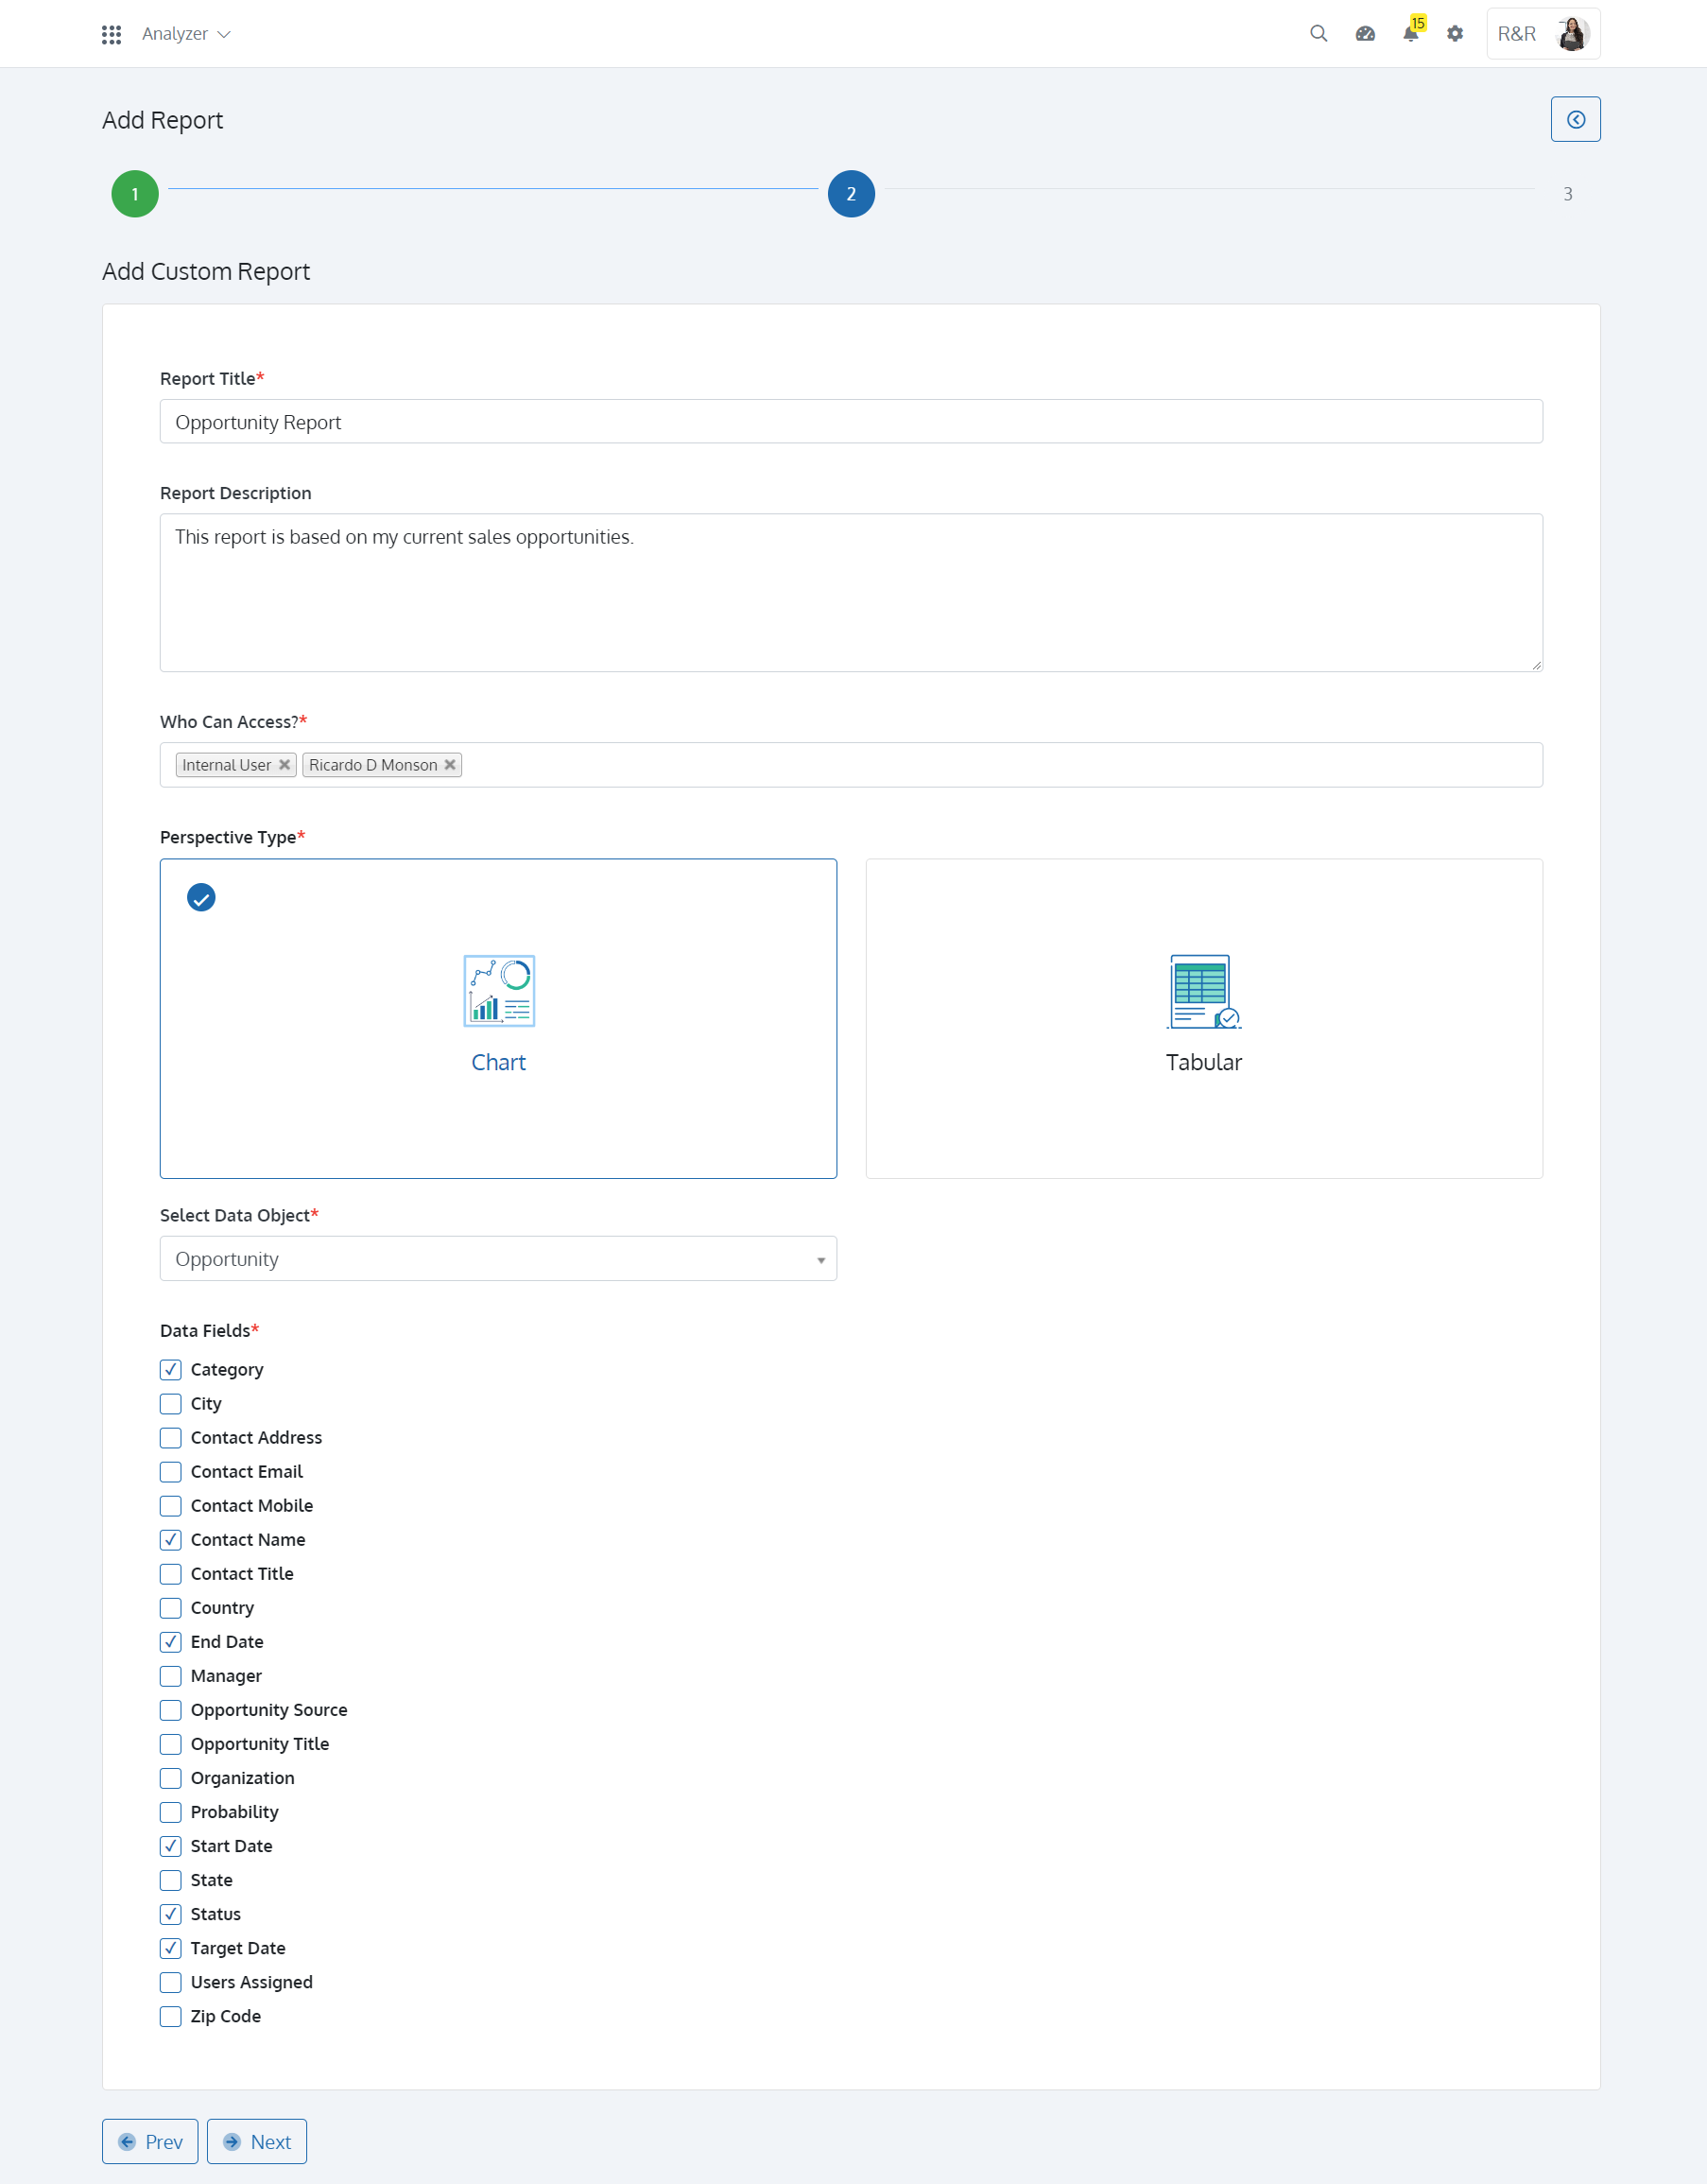
Define your Custom Report by entering the ‘Report Title’and ‘Report Description’. Select ‘Who can Access’ the Report, followed by selecting the Perspective Type as ‘Chart’ or ‘Tabular’. Select the Data Object followed by selecting the ‘Data Fields’.
Perspective Chart
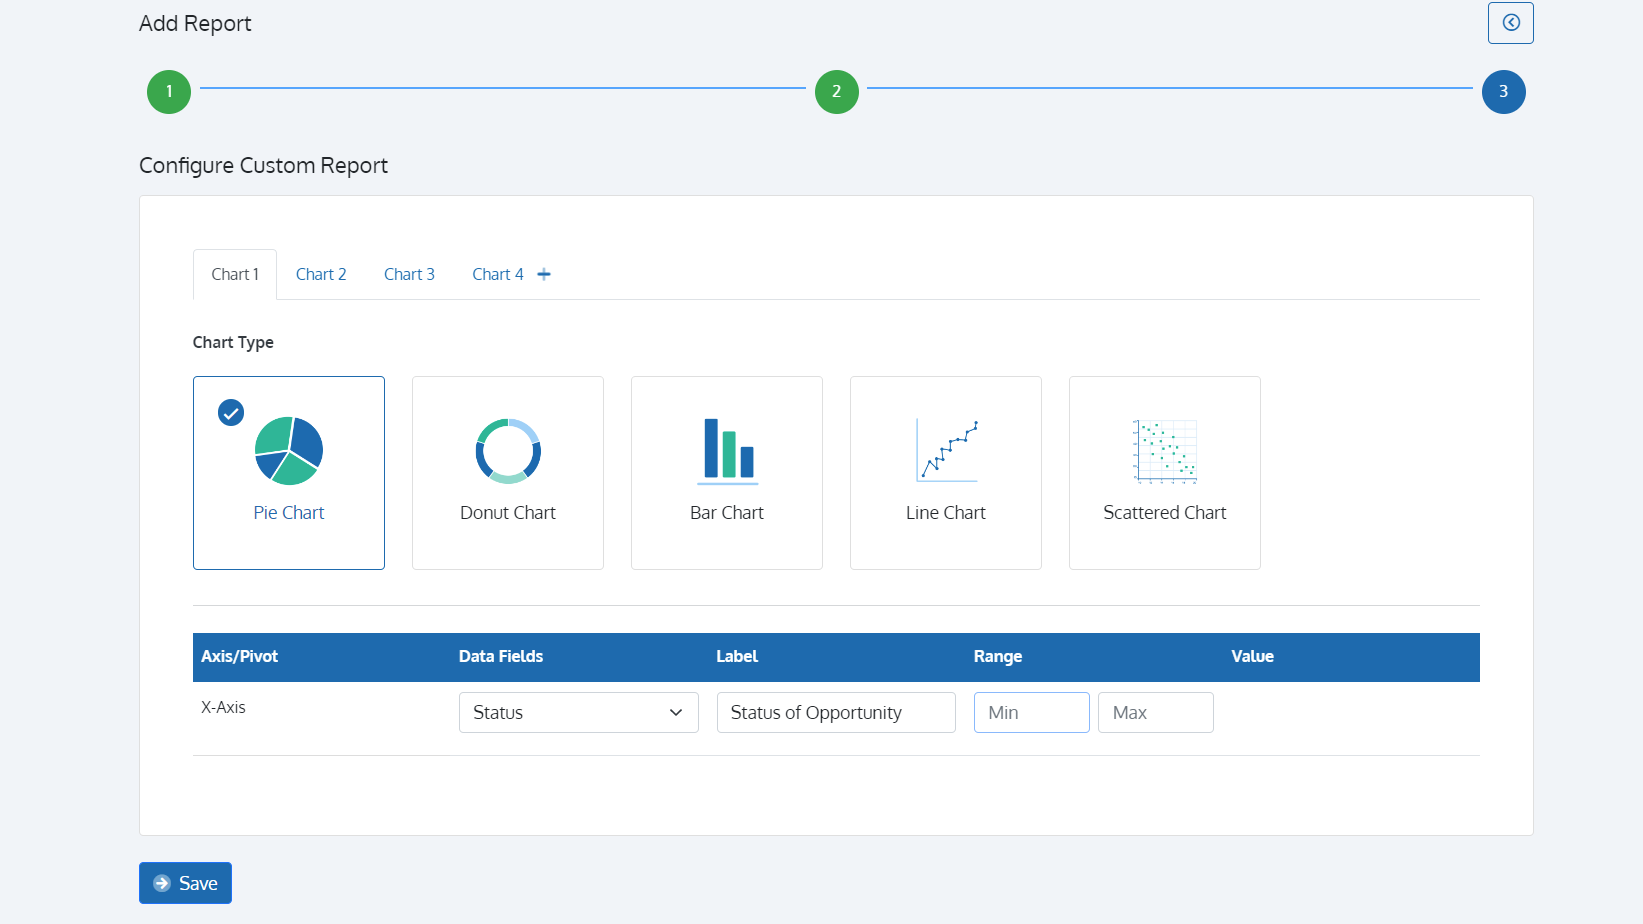
Multiple pieces of data may be graphically compared using charts. You can grasp and retain information better by using charts. The majority of people comprehend images more rapidly than long passages of text. You may communicate your message persuasively and give credibility to your reports by using effective graphs. You can ‘Configure Custom Report’ by selecting the Chart Type and entering the information required for the Chart like ‘Data Fields’, ‘Label’, ‘Range’, etc. With the Analyzer App of Batoi CloudSpace, you can create charts like ‘Pie Chart’, ‘Donut Chart’, ‘Bar Chart’, ‘Line Chart’, and ‘Scattered Chart’. You can also add more charts if required in the same report.
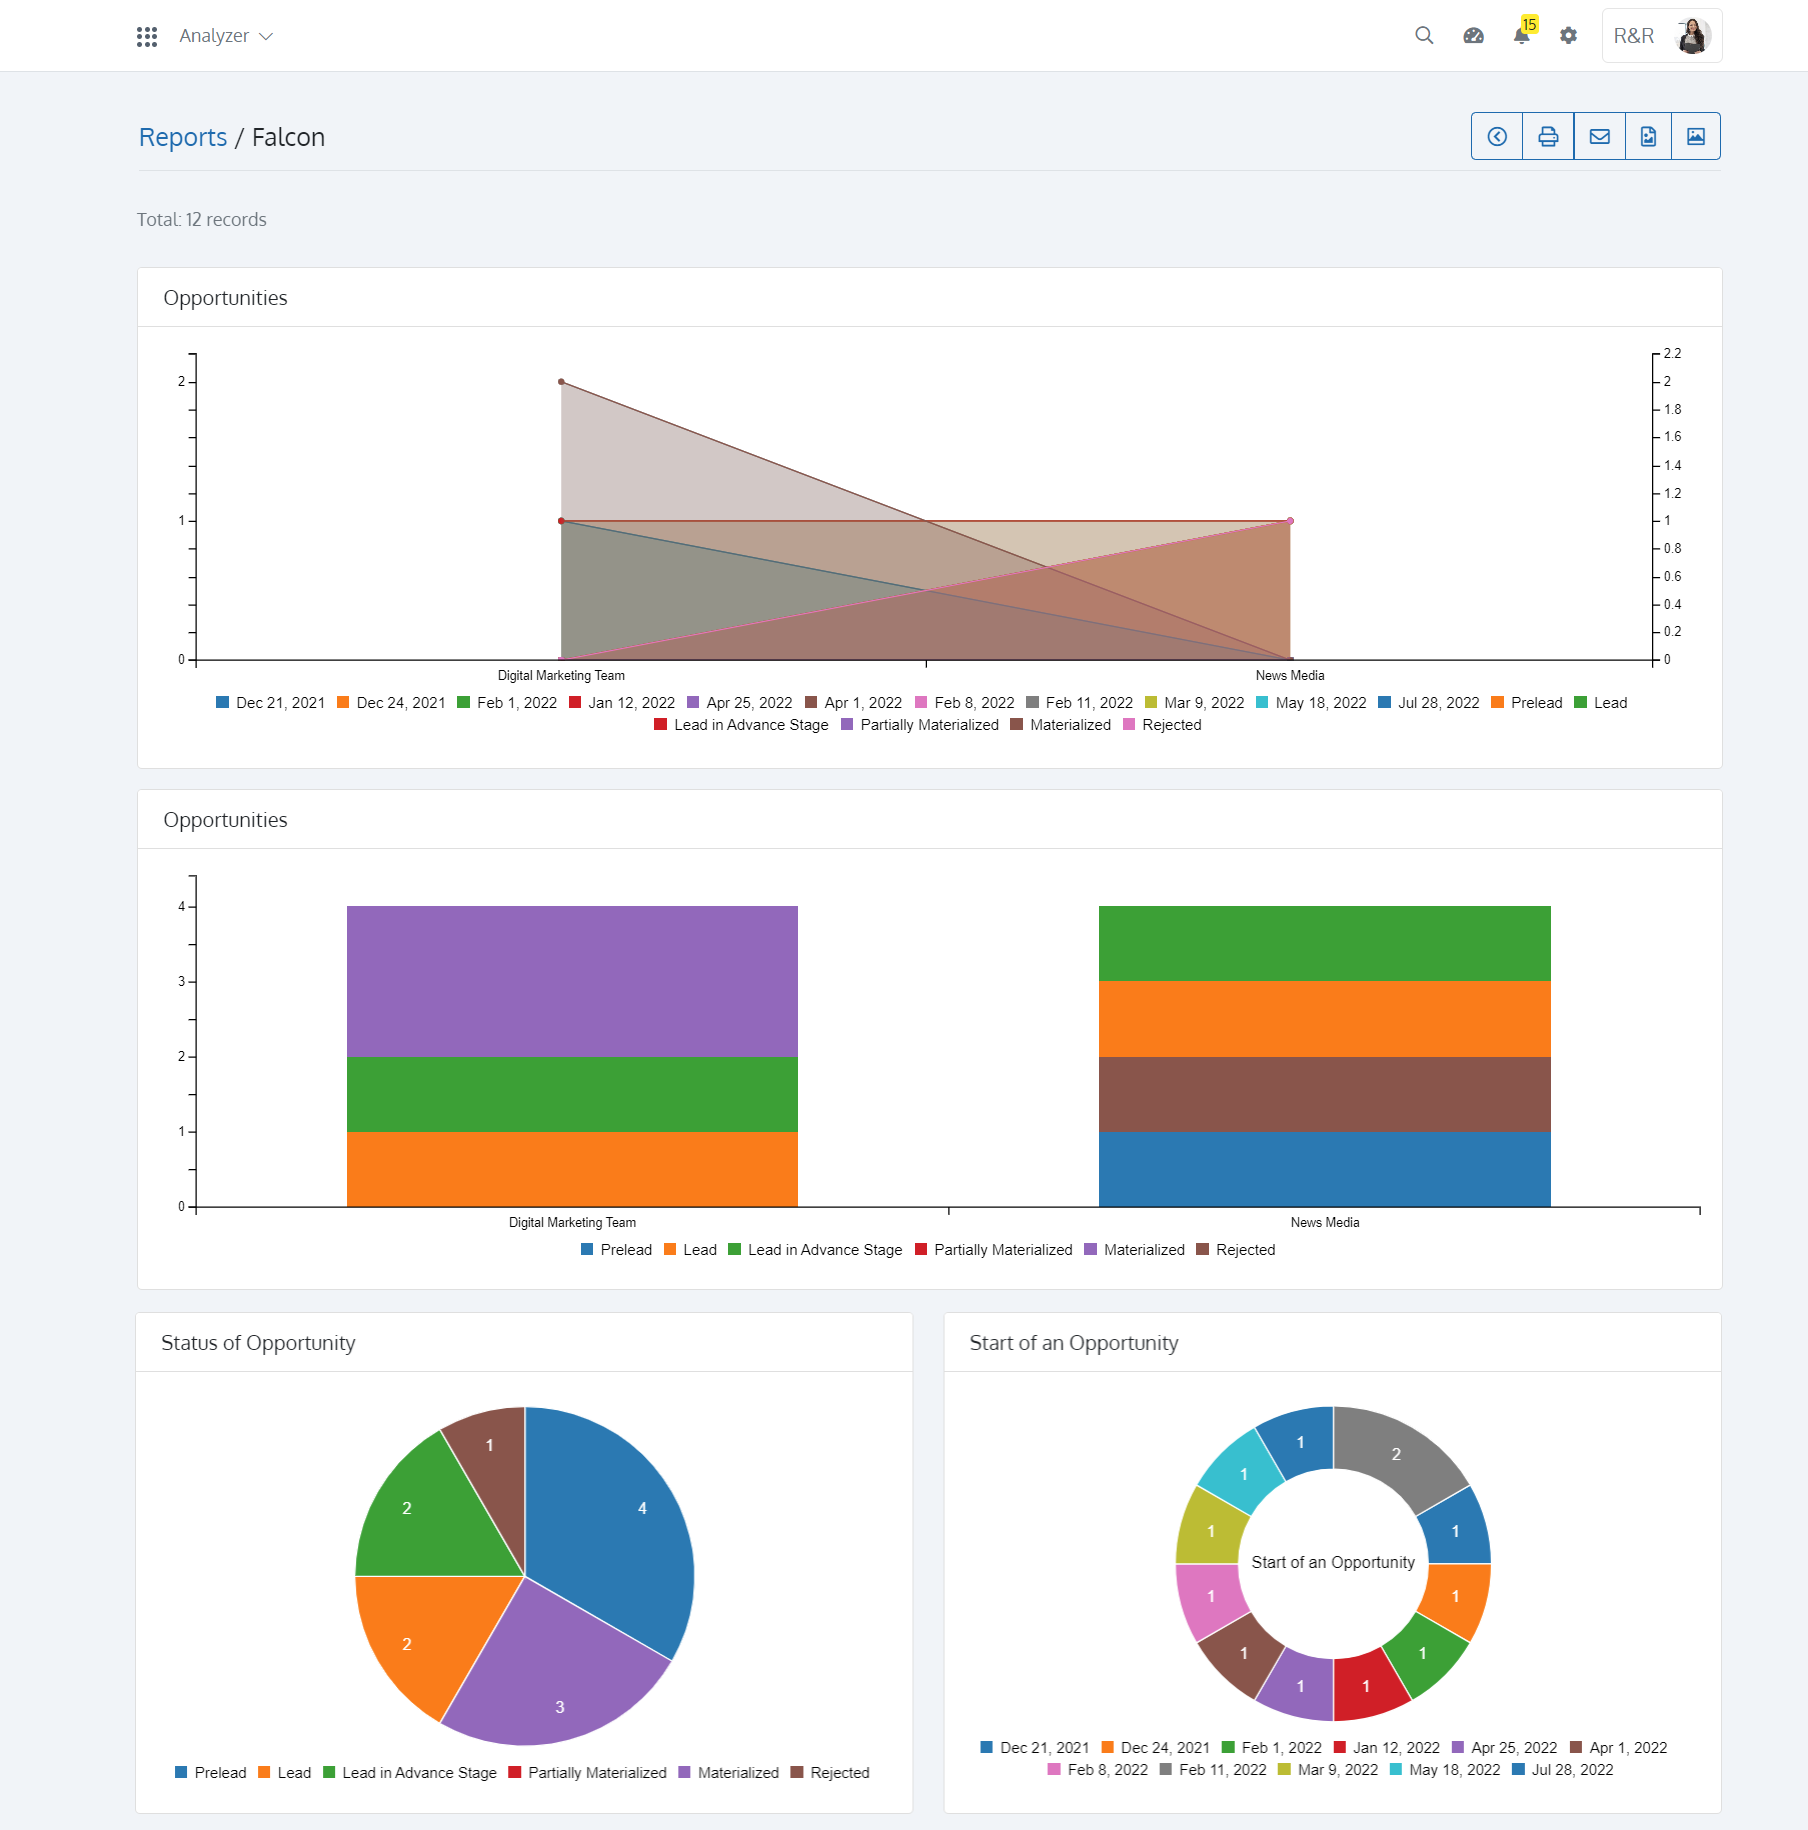
Once created, you can view the Report from the ‘List of Reports’ page. With the Analyzer app on Batoi CloudSpace, you can ‘Print’ the report and ‘Export as PNG’ or ‘Export as SVG’ for future reference. You can also send ‘Email’ to prospective people.
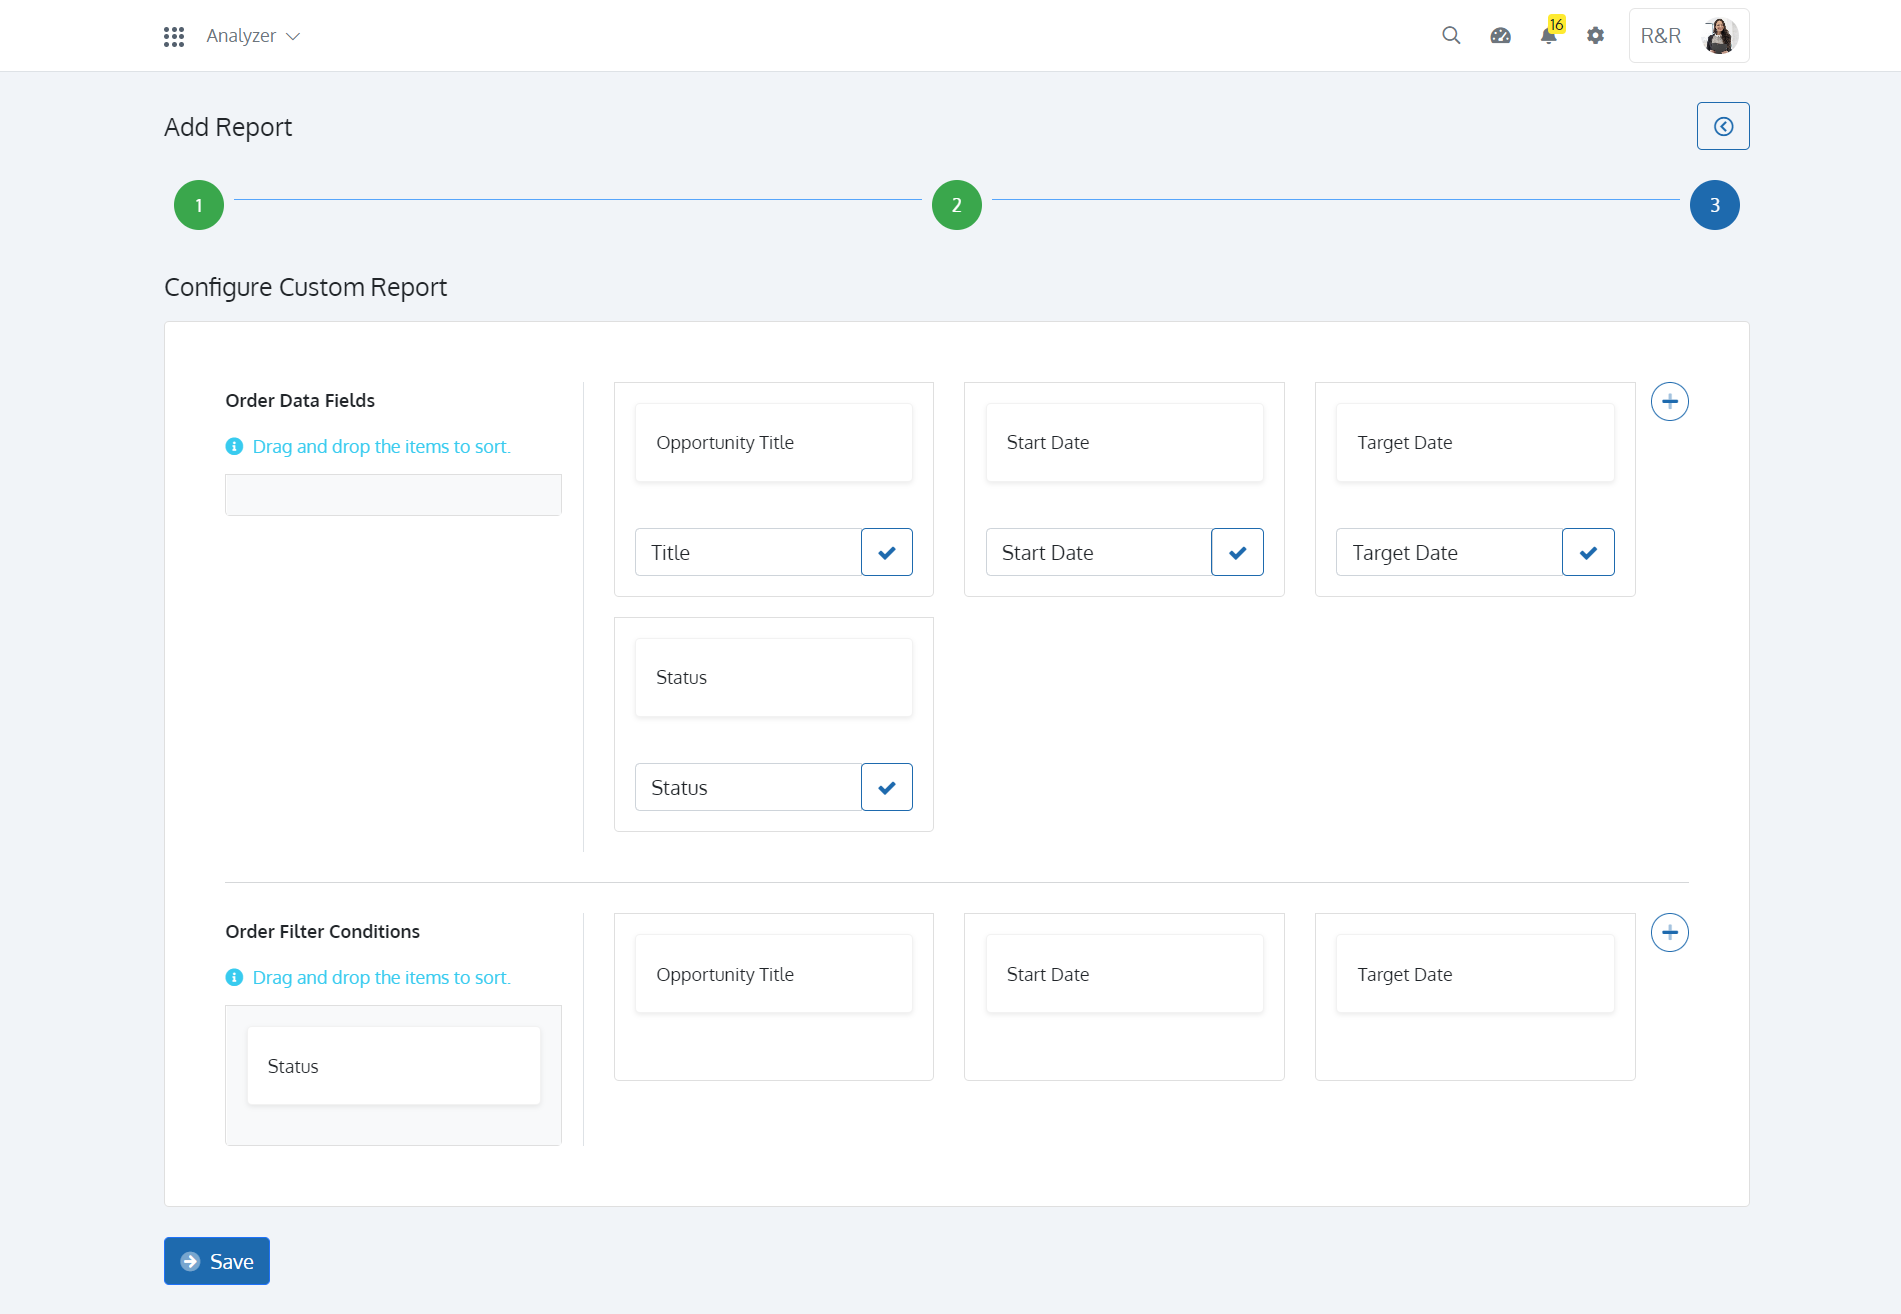
Perspective Tabular
The Tabular Report is smart if your report has a manageable number of fields. You may organize data into several columns for analysis. You can ‘Configure Custom Report’ by ordering Data Fields into different columns. The Analyzer App of Batoi CloudSpace allows you to edit Column Names and Order Filter Conditions. The simple drag and drop feature makes it convenient to generate Tabular Reports.
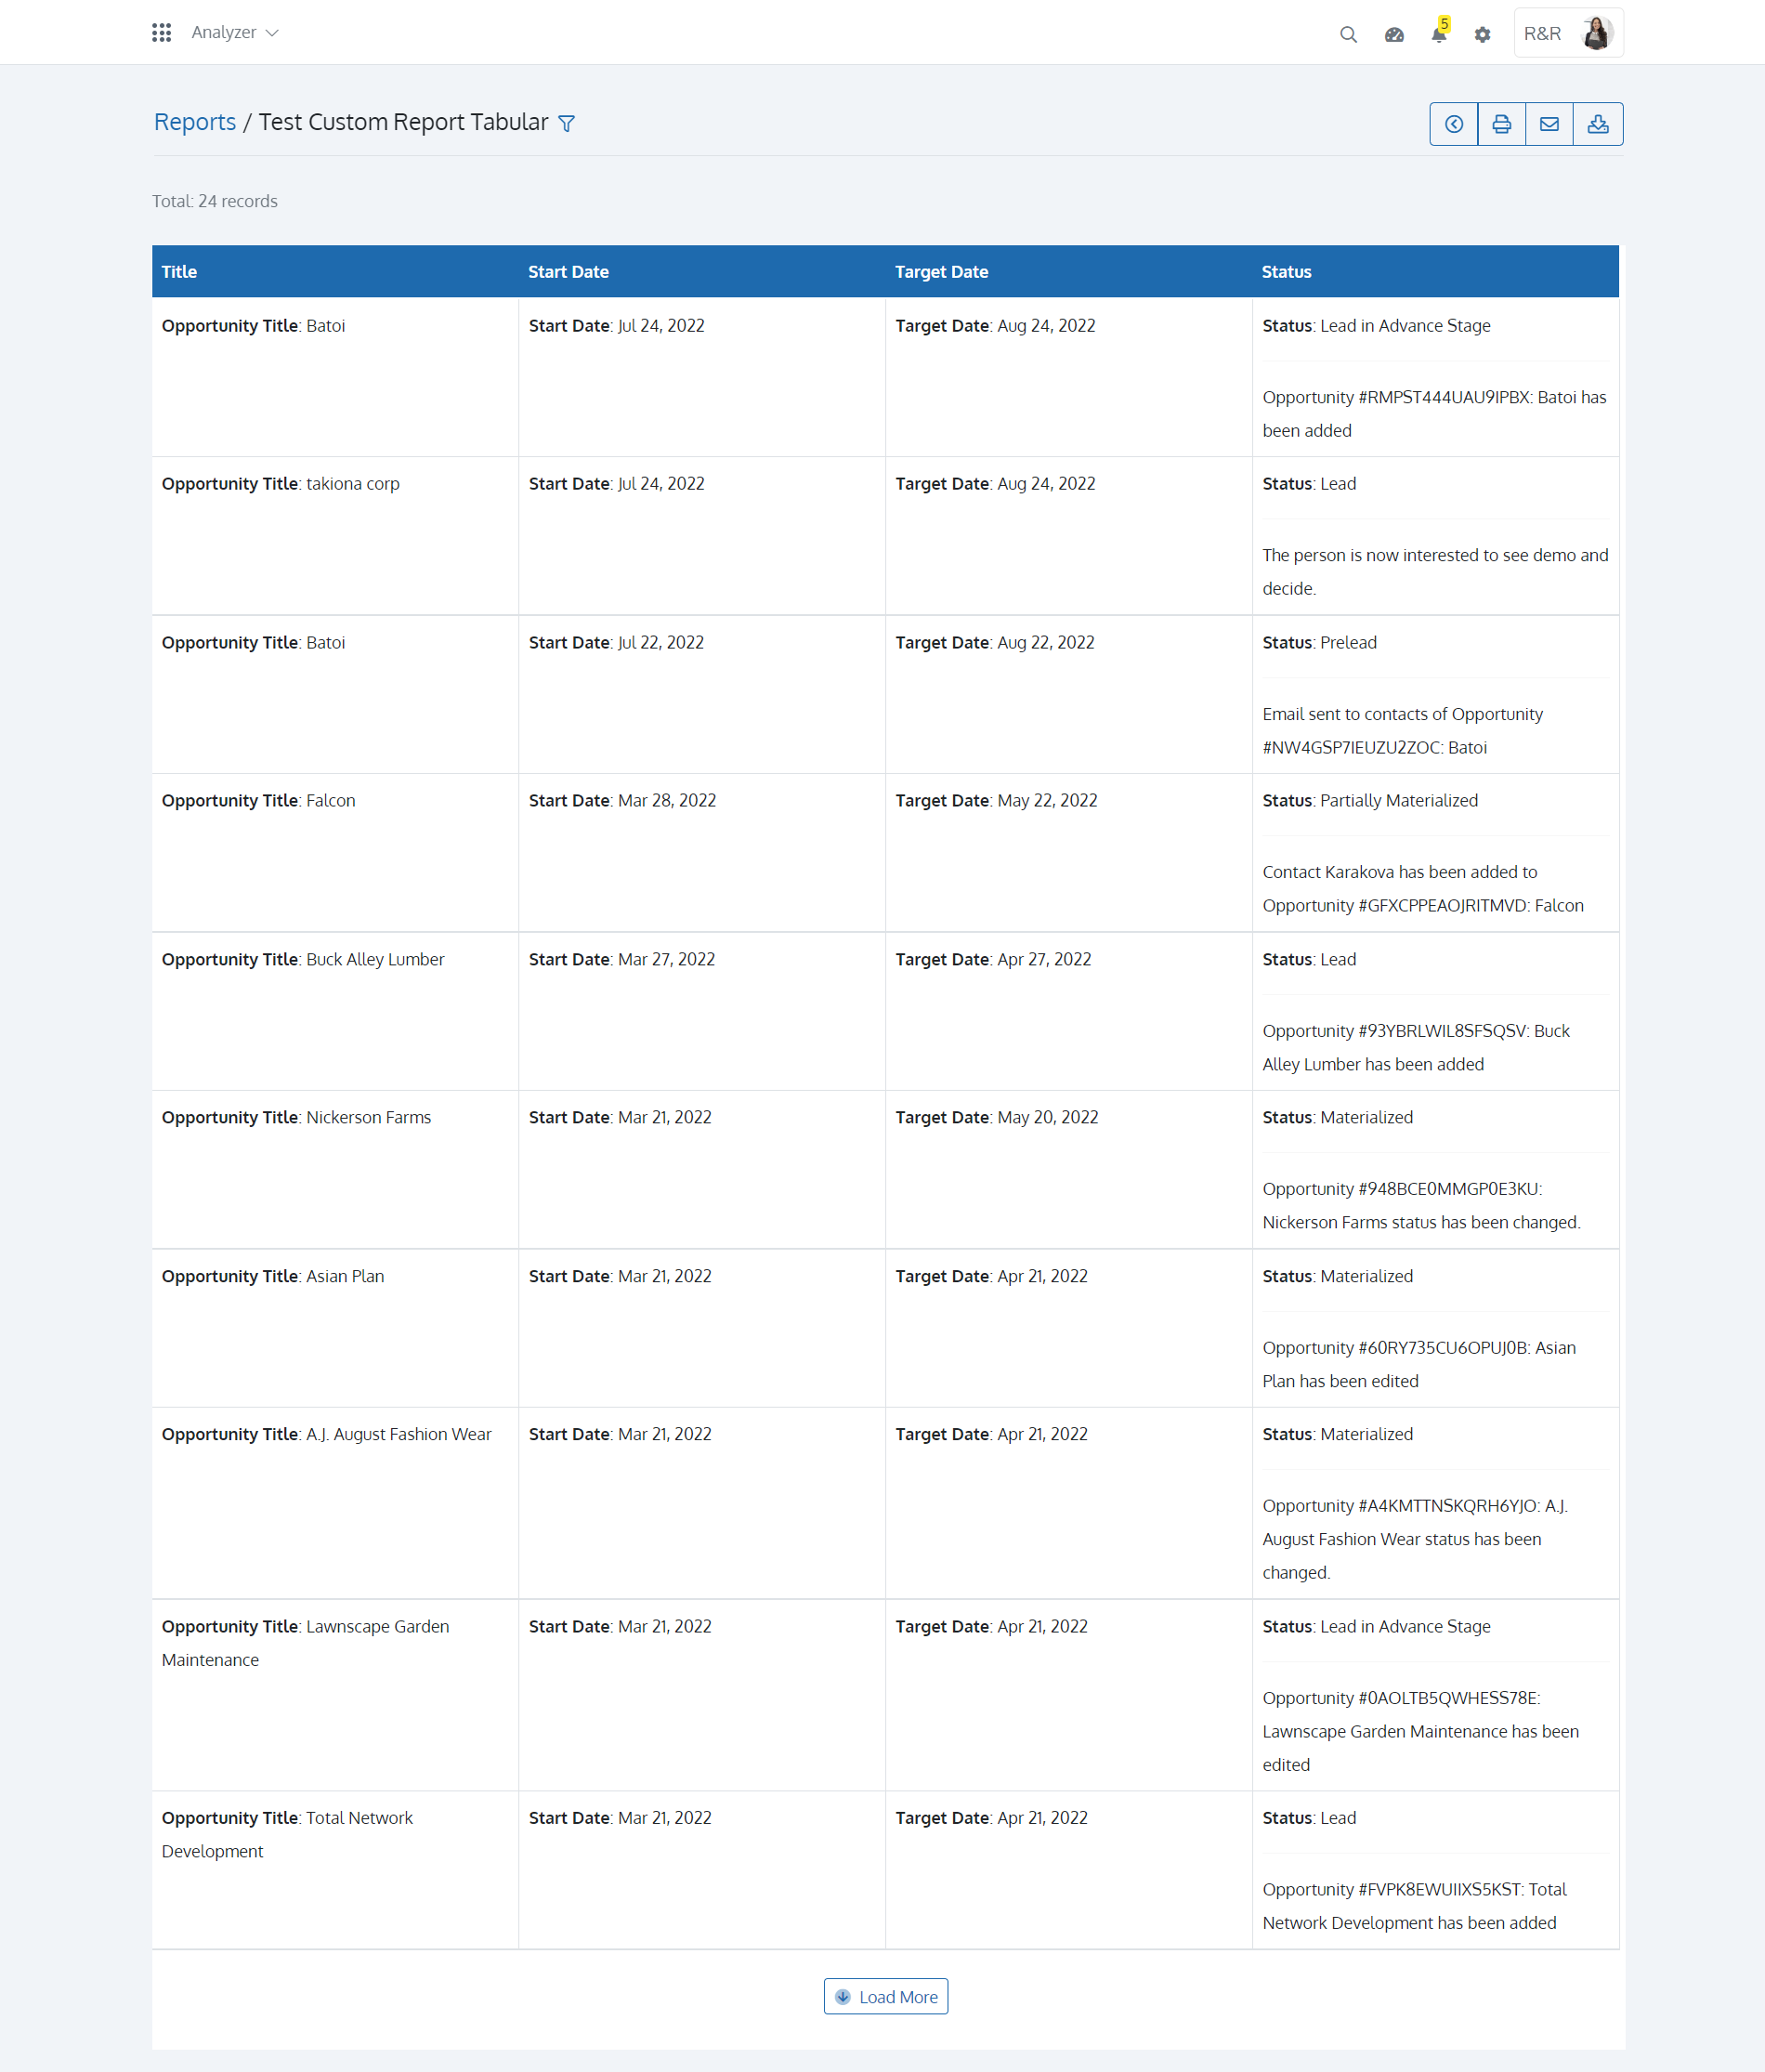
Once created, you can view the Report from the ‘List of Reports’ page. With the Analyzer app on Batoi CloudSpace, you can ‘Print’ the report and export it as CSV for future reference. You can also send ‘Email’ to prospective people.
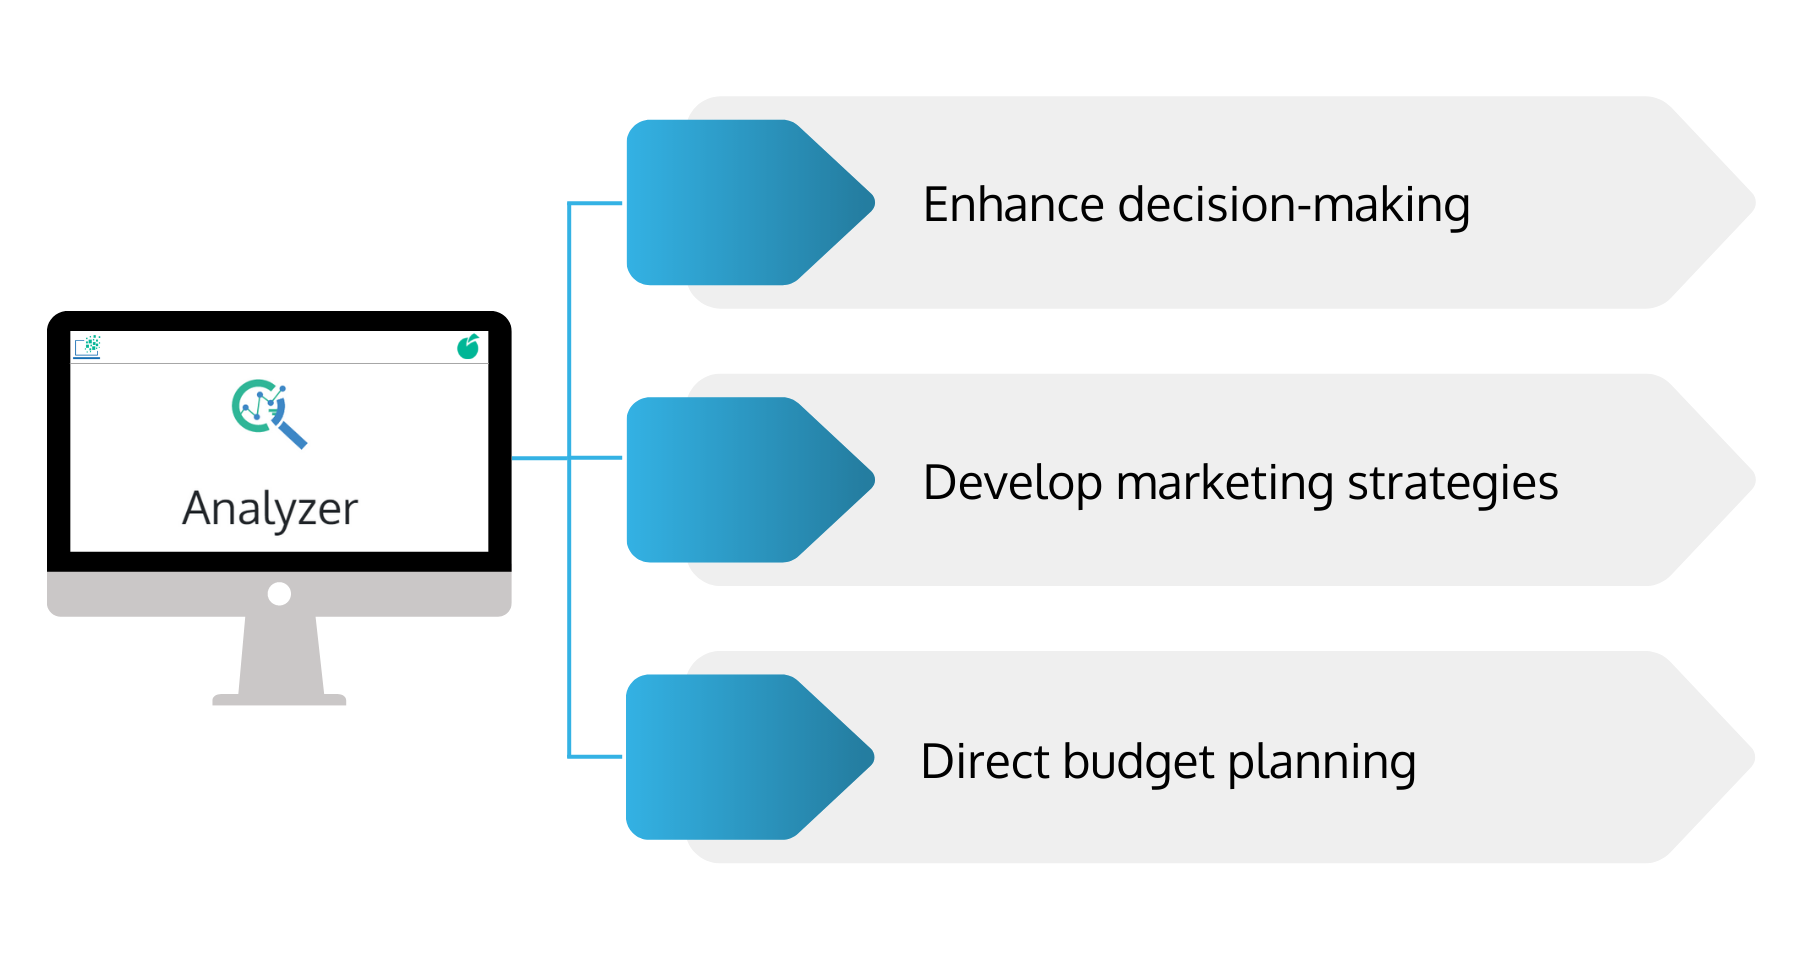
Reports from the Analyzer app will give you and the managers crucial information that may be utilized to generate projections for the future, develop marketing strategies, direct budget planning, and enhance decision-making.